“Human-driven operations are not going away: Uber is the best-positioned company for the hybrid model.”
Peak absorption is the key thesis. A hybrid network buys human supply only at peaks, and an AV fleet cannot replicate that labor pool.
The decision, step by step
-
1Entry · 18 Aug 2026
Started legging in
-
210 Sep 2026
Thesis notes completed
Seventeen notebook pages, consolidated into one thesis:
- Trading at a market multiple, 20–23× core earnings, with gross bookings up about 20% and operating income tracking them
- Net debt about 19% of total assets; insurance float income more than covers interest
- Peak absorption: the key thesis
- Officers keep accumulating shares
-
3Now · registered 20 Oct 2026
Four tests that would put the thesis under review
- AOI/GB down year on year in Mobility or Delivery for two quarters, through Q4 2028
- Gross bookings, trips and revenue decelerating together
- Monthly trips per MAPC degrading from the current 6.1–6.2
- Collected cash over gross bookings (adjusted CFO/GB) dropping: the test of gross bookings inflated with promotions
Starting points, Q2’26: AOI/GB 5.22% in Mobility and 2.49% in Delivery; 6.1–6.2 monthly trips per MAPC; adjusted CFO/GB 3.32%. First reading with the Q3 2026 results.
-
4Q3 2026 results
AOI/GB, the clean comparison
Until Q1 2027, each segment’s adjusted operating income against its own gross bookings is the only true comparison; year-ago operating income is contaminated by the UK change.
-
5Q1 2027
Revenue comparable again
Mobility revenue is comparable year on year once the UK reclassification annualizes.
-
62027
London and Munich go driverless
A test of whether the sequence of Denver, Las Vegas, San Diego and Tampa, flipping within a single month, generalizes to different cities and environments.
The note
i filing · ii management · iii third party · H my calculation · quotes from my call notes
The thesis in brief
The future of Uber’s Mobility is a hybrid provider: traditional human-driven operations plus an AV-partnered fleet, a platform plus services.
- Trading at a market multiple, 20–23× core earnings, while gross bookings grow about 20% and operating income tracks them. H
- The balance sheet is not aggressively levered: about 19% of total assets, which could rise to 25% with the Delivery Hero acquisition. H
- Insurance float income more than offsets interest expense.
- AV is currently unprofitable for everyone, Waymo included.
- Lots of optionality in AV partnerships ($1.5b deployed against a $10b headline), while 75% of Uber is international, where AV disruption is more difficult.
- AOI/GB has improved quarter on quarter for the last four quarters, with gross bookings up 20% year on year: Delivery growing, Mobility growing, and Freight as AV optionality. H
- Human-driven operations are not going away: Uber is the best-positioned company for the hybrid model. Peak absorption is the key thesis.
- Officers keep accumulating shares month after month; the COO and president added about 20% to his holding in the open market in September.
- Good management: in Q1’26 Uber dropped adjusted EBITDA for segment operating income, which includes SBC and depreciation and amortization.
- Competition is driven by ETA first and price second, so platform optimization is Uber’s strength, through its app (for example, Wait & Save). That favors a large fleet, and the hybrid model benefits from a lower breakeven.
- Airports’ share of Mobility
- 15%
- US riders who take trips outside their home city
- 40%
- US profit from outside the 20 largest metros
- 75%
- US cities not workable for AVs, per Uber’s white paper
- 8,000
The UK change
The disputed VAT, March ’22 to December ’25: $1.8b of unpaid VAT is in dispute in the UK, recorded as a receivable in other assets on the balance sheet. Management believes it will recover it. Will it? i
Uber paid less because it considered itself a tour operator and applied the Tour Operators’ Margin Scheme (TOMS). If Uber loses, the receivable must be written off, probably as an increase in cost of revenue.
- A year: $1.8b over 2.5 years
- $720m
- Potential, if extended to December ’26
- +$900m
- Total potential taxes due
- $2.7b
However, Uber is not paying the tax. The proof: in Q2’26 gross bookings grew 20% year on year in constant currency and operating income 28%. Is the driver absorbing it? From principal to agent: from driver to passenger, Uber is just the intermediary, and the VAT is on the fare. HMRC can challenge this. To check: Bolt’s news on it.
What the reclassification contaminates
- The H1’26 margin improvement comes from gross margin only: an accounting event, the UK change.
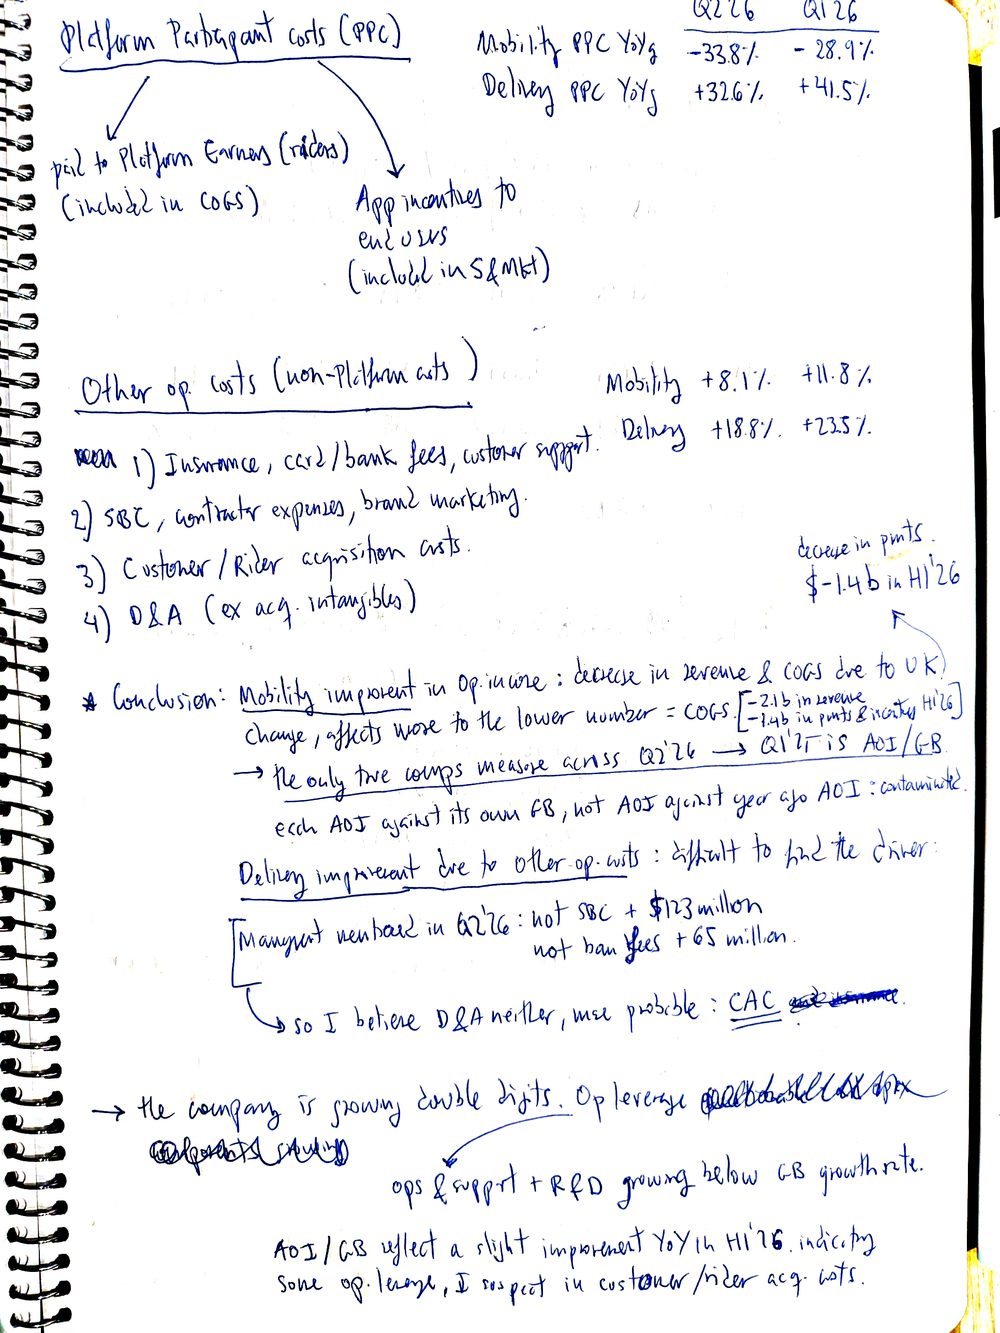
- Mobility’s improvement in operating income comes from the drop in revenue and cost of revenue due to the UK change, which weighs more on the smaller number, cost of revenue: −$2.1b in revenue and −$1.4b in payments and incentives in H1’26. i
- The big spread between gross bookings and revenue in Q2’26 and Q1’26 is the revenue reclassification. Does the UK change affect only these two quarters? Mobility revenue is comparable only from Q1’27.
The only true comparison from Q2’26 to Q1’27 is AOI/GB: each segment’s adjusted operating income against its own gross bookings, not against year-ago AOI, which is contaminated.
Business model mechanics
Revenue is a take-rate residual, not a gross measure of activity; gross bookings are the volume measure.
The moat is the aggregation of fragmented supply. Atomized drivers bring their own capital, cannot coordinate and have no bargaining power.
Before AV, the model was asset-light; operating leverage may disappear now.
Highly fragmented markets, with low barriers to entry: 70 countries, 15K cities.
Seasonality: up in Q4, down in Q1.
The driver gets 70% of every fare. That is the cherry, and the entire prize in the AV question.
| Q2’26 | Gross bookings | “Other” opex |
|---|---|---|
| Mobility | 50% | 63% |
| Delivery | 47% | 34.4% |
| Freight | 3% | 2.6% |
| Platform scale | |
|---|---|
| Monthly active platform consumers | 208m, +16% YoY |
| Monthly active drivers and couriers, Q2’26 | 8.8m |
| Uber One members, in 30 countries | 46m (Dec ’25), 50m (Q1’26) |
Uber One is half of Mobility and Delivery gross bookings: customer retention, against a lower take rate. In Q4’25, 58% of first-time Delivery users were new to the platform, and consumers using both Mobility and Delivery generated three times the gross bookings of those using only one app. ii
Growth, engagement and reporting
| Full year | FY’25 | FY’24 | FY’23 |
|---|---|---|---|
| Revenue growth | 18.3% | 18% | — |
| Gross margin | 39.8% | 39.4% | 39.8% |
| Operating margin | 10.7% | 6.4% | 3% |
R&D flat. Marketing flat in FY’24 and FY’23, up 12.9% in FY’25. SG&A flat. Operations and support up 1% in ’24 and 4.5% in ’25.
| H1’26 against H1’25 | |
|---|---|
| Revenue | +13.3% |
| Cost of revenue | +3.6% |
| Operations and support | +15% |
| Sales and marketing | +25.3% |
| R&D | +20.5% |
| G&A | +30.7% |
| Total opex | +22.3% |
| Operating income | +42.4% |
| Operating margin | 13.9% vs 11.07% |
Due to gross margin only: an accounting event, the UK change.
MAPC, monthly active platform consumers: unique consumers who completed a Mobility ride or received a Delivery at least once a month.
- Gross bookings
- Revenue
| YoY growth | Q2’26 | Q1’26 | Q4’25 | Q3’25 | Q2’25 |
|---|---|---|---|---|---|
| MAPC | +16% | +17% | +18% | +17% | +15% |
| Monthly trips per MAPC | +2% | +3% | +3% | +4% | +2% |
| Trips | +18% | +20% | +22% | +22% | +18% |
| Gross bookings | +22% | +21% | +22% | +21% | +18% |
| Revenue | +11% | +10% | +19% | +19% | +18% |
| Mobility gross bookings | +20% | +20% | +19% | +19% | +18% |
Monthly trips per MAPC are stable at 6.1–6.2. The big spread between gross bookings and revenue in Q2’26 and Q1’26 is the UK change.
The reporting change, a good management signal
Since Q1’26 Uber has reported segment operating income instead of segment adjusted EBITDA. What changes: it includes SBC ✓, and depreciation and amortization, excluding amortization of acquired intangible assets. Management states that the CEO uses it to evaluate performance, plans and strategic decisions. i
Delivery advertising
- Q2’26 revenue growth: $182m from ads, 16.5% of the total
- +$1.1bn
- H1’26 revenue growth: $362m from ads, 15% of the total
- +$2.4bn
Good quality of earnings: growth at zero incremental cost. H
Quality of earnings
The method: take reported segment operating income (improved by the reporting change), then charge each segment its share of corporate G&A and platform R&D, allocated by its share of “other” costs, as a proxy for organizational intensity. Divide by gross bookings, which don’t deduct incentives.
| Mobility, $m | Q2’26 | Q1’26 | Q2’25 | Q1’25 |
|---|---|---|---|---|
| Segment operating income | 2,215 | 2,029 | 1,729 | 1,587 |
| − G&A and R&D, “other” basis | −702.5 | −670.4 | −612.8 | −582.2 |
| Adjusted operating income | 1,513 | 1,359 | 1,116 | 1,005 |
| AOI / GB | 5.22% | 5.15% | 4.70% | 4.74% |
| AOI growth, YoY | +35.6% | +35.2% | — | — |
| Reported operating income growth | +28.1% | +28% | ||
| Gross bookings growth, cc | +20% | +20% |
No sign of “buying” volume. But all opex lines are growing: all the change was in cost of revenue.
| Delivery, $m | Q2’26 | Q1’26 | Q2’25 | Q1’25 |
|---|---|---|---|---|
| Segment operating income | 1,055 | 961 | 766 | 671 |
| − G&A and R&D, “other” basis | −371.9 | −377.5 | −295.3 | −296.8 |
| Adjusted operating income | 683 | 583 | 471 | 374 |
| AOI / GB | 2.49% | 2.24% | 2.17% | 1.84% |
| AOI growth, YoY | +45% | +55.9% | — | — |
| Reported operating income growth | +38% | +43% | ||
| Gross bookings growth, cc | +25% | +23% |
No sign of buying volume through incentives or discounts.
- Mobility
- Delivery
| Where the change sits, YoY | Q2’26 | Q1’26 |
|---|---|---|
| Cost of revenue | +2.7% | +4.6% |
| Operations and support | +15.7% | +14.2% |
| Sales and marketing | +25.2% | +25.4% |
| R&D | +24.2% | +16.7% |
| G&A | +39.8% | +21.4% |
| D&A | +7.4% | +7.6% |
| Platform participant costs, YoY | Q2’26 | Q1’26 |
|---|---|---|
| Mobility PPC | −33.8% | −28.9% |
| Delivery PPC | +32.6% | +41.5% |
| Mobility other operating costs | +8.1% | +11.8% |
| Delivery other operating costs | +18.8% | +23.5% |
Other operating costs, the non-platform costs, are: (1) insurance, card and bank fees, customer support; (2) SBC, contractor expenses, brand marketing; (3) customer and rider acquisition costs; (4) D&A excluding acquired intangibles. Payments fell by $1.4b in H1’26.
Conclusion. Mobility’s improvement is the UK change working through revenue and cost of revenue. Delivery’s comes from other operating costs, and the driver is difficult to find. Management said in Q2’26 that it was not SBC (+$123m) and not bank fees (+$65m), so I believe not D&A either. More probable: customer acquisition costs.
The company is growing at double digits, with operations and support and R&D growing below gross bookings. AOI/GB shows a slight improvement year on year in H1’26, so there is some operating leverage, I suspect in customer and rider acquisition costs.
Cash quality, valuation and balance sheet
The cash-quality ratio: when the measures converge, it is evidence that the improvement is real. The test: gross bookings are gross of discounts, refunds and incentives, so if they are inflated with promotions, the ratio of collected cash to gross bookings falls.
| $m | Q2’26 | Q1’26 | Q4’25 | Q3’25 | Q2’25 | Q1’25 |
|---|---|---|---|---|---|---|
| CFO ex SBC and insurance accretion | 1,925 | 1,435 | 1,851 | 1,271 | 1,277 | 1,214 |
| Adjusted CFO / GB | 3.32% | 2.67% | 3.42% | 2.55% | 2.73% | 2.84% |
| Adjusted CFO growth, YoY | +50.7% | +18.2% |
| Cash generation, $m | FY’25 | FY’24 | FY’23 |
|---|---|---|---|
| Adjusted CFO, ex working capital and SBC | 6,046 | 2,967 | 1,485 |
| Growth | +104% | +100% | |
| FCF / net income | 60% | 30% | 79% |
| Capex / revenue | <1% | <1% | <1% |
| Other income, $m | Q2’26 | Q1’26 |
|---|---|---|
| Income from operations | 1,890 | 1,923 |
| Other income (expense) | 1,342 | (20) |
| Other income as a share of income from operations | +71% | −1% |
Core earnings and the multiple
- FY2025 core earnings per share, excluding interest, taxes and equity investments: 2.63. Trailing four quarters: 3,813 + 2,887 = 6,700, ÷ 2,060.763m shares = 3.25. Both positive; a benefit. H
- At $75, price to core earnings is 23×, with Mobility adjusted operating income growing 35% year on year, Delivery 45% and gross bookings 20%. H
- At $75, the Q2’26 run-rate P/E is 29×. The TTM P/E is 16.4×, but it includes unrealized equity gains hitting the income statement: not a relevant measure, because of the equity investments. H
- FCF yield, Q2’26: Q4’25 FCF (5,823) ÷ equity at $75 (154,000) = 3.8%. On the H1’26 FCF run rate, 5.2%. H
Balance sheet
| Cash as a share of the balance sheet | 8% |
|---|---|
| Net debt / total assets | 19% |
| Deferred tax assets | 10.9b (Q4’25) → 10.1b (Q2’26), 15% of assets |
| Goodwill | 8.9b → 9.5b, 14.4% of assets |
| Diluted shares outstanding | −1.4% in FY’25, +2.8% in FY’24; the same in Q2’26 as in Q2’23: no share growth in three years |
From FY2024 to now, every quarter, interest on the debt has been free, thanks to the interest received on reserves. ✓
Peak absorption
The key thesis. The risk is that Uber just meets incremental demand, which moves it toward Booking’s OTA model: a 15–25% take rate, from the current 30%.
Urban mobility peaks at 2.5–3× average demand. A fleet sized for the peak idles at 33–40% utilization. Utilization is the largest determinant of cost per ride: going from 35% to 90% cuts the cost per ride by 2.5×.
For an AV fleet, the need for charging points makes it worse: the fleet cannot afford to take vehicles offline during the peak, so a pure-AV fleet needs surplus above the peak requirement. A hybrid network buys human supply only at peaks: the optimal configuration, and Uber’s stated strategy.
- Drivers who work under 20 hours a week
- 61%
- Drivers who work under 40 hours a week
- 85%
That is the peak-capable labor pool, and an AV fleet cannot replicate it. With human supply, idle time belongs to the driver. ii
Congestion management. A poorly managed AV fleet can increase congestion. Human-driven supply has a natural constraint: drivers show up when peak demand pushes prices up, and log off when demand falls. An AV stays in service as long as revenue covers operating costs, with potentially empty cars worsening traffic.
Management’s claim: AVs on the Uber platform get 30% more utilization than on standalone platforms, with Uber becoming the platform between riders and AV companies, and the hardware being commoditized. AVs as physical AI: 10K GPUs needed to develop the software. ii
Density and calendar time
Uber’s 2026 white paper: 8,000 cities in the US won’t be workable for AVs. Fleet economics require density, 25+ trips a day for a $100K asset to amortize, and demand in a town of 30,000 people is too low for that. ii
Balaji, on the Q2’26 call: 30% of US gross bookings and 25% of profits come from the top 20 cities; 70% of gross bookings and 75% of profit are international, where AV fleet economics are harder: perhaps out of AV competition. ii
AVs deploy market by market: time is a scarce good for AV companies. The constraint on AV expansion is calendar time, and it cannot be compressed by spending:
- Per-metro approval: permits don’t transfer.
- Safety is city- and region-specific: snow, rain, double parking.
- Vehicles are a production schedule.
- Depots, charging and grid interconnection: multi-year utility queues.
This is structural to the AV environment: it doesn’t require Uber to be good at anything. Which leaves open: will the AV insurance program succeed? Will Uber Autonomous Solutions? Will partners stay in the Uber app?
To monitor: cities per year per AV competitor, and the time from announcement to paid service. Is it shortening? Then the time-constraint moat is compressing.
The coalition defending hybrid
Who needs a person: older adults who need help reaching pick-up points or with a changing curb; disabled adults with folding wheelchairs; people who need help with luggage; a family of four with a lot of luggage at the airport. Waymo is not wheelchair accessible, and neither is the Jaguar I-PACE or the Zeekr Ojai.
Uber, the labor lobby, disability advocates and the senior voting cohort: a hard coalition, defending hybrid models.
AV liability, reliability and Uber’s own AV product
Liability changes shape
- AV insurance premium: unknown, if it indeed exists.
- An AV crash is potentially a correlated product defect across the fleet: recall expense, and product liability replacing negligence. Before, AV operators were pricing above Uber while scaling; Waymo cut prices 9.7% quarter on quarter while Uber raised its own. iii
- New AV entry barriers: safety profile, capital, depots, permits.
- Waymo is vertically integrated: software, fleet, consumer brand, app. Uber is just the app, and product liability can be shared across the chain.
| Zagreb example | Role |
|---|---|
| Pony.ai | L4 software on a BAIC fleet |
| Uber | The app: booking, payment, customer service, plus the global network and demand aggregation |
| Verne | Fleet owner: depot, charging, cleaning, regulatory approvals |
Correlated failure: the outages problem
On December 20, ’25, an SF substation fire cut power to 130K customers. Waymo treats dark signals as four-way stops, sometimes requesting remote assistance, and that is where the bottleneck shows: 70 remote operators worldwide; the fleet stalled 1,500 times for more than 2 minutes, blocking intersections; 911 called Waymo 31 times; a fire truck stalled. iii
Wuhan, March ’26: 100 Apollo Go robotaxis suddenly froze, with passengers stuck inside. iii Over time, though, every issue is engineered down.
AV fleet malfunctions are highly correlated; a human fleet’s correlation is zero. One software, one system: the worst state has more depth and only one direction. Another argument for a hybrid fleet.
Uber Autonomous Solutions
Strongest points: complex venue and event management; fleet financing; regulatory compliance services; the in-car experience; AV insurance, as a single master policy with Uber assuming no tail risk. Good for start-ups, not for Waymo, Zoox or Tesla.
Not scarce, not proven as a moat: AV 2.0 training data (maybe neural nets through some partnership?); data-enriched mapping; remote assistance (contested: Waymo runs 1:43, but 70 operators were not enough in some incidents); fleet operations, which are fragmented.
Management’s claim: partnering with Uber’s built-in demand lifts utilization to 25–30 trips per vehicle per day. ii
AV partners, by layer of the stack
Type A: Wayve and Nuro software, on NVIDIA’s design and the Nissan LEAF program. Type B, the problem: Verne, where the partner owns the fleet, brand and app; Waymo, the same. Uber’s financial muscle can crowd out Verne and Bolt, not Waymo.
| Layer | Partner | Status |
|---|---|---|
| Software | Aurora | Self-driving trucks between Dallas and Houston, via the Uber Freight platform |
| Autobrains | June ’26 Munich launch on the Uber platform | |
| Baidu | Partnership tests not begun | |
| Nuro | AV software in Lucid Gravity SUVs (Uber app) in San Francisco and Houston; Series E round plus milestone-based investments | |
| Pony.ai | The Uber, Pony.ai and Verne agreement in Zagreb | |
| Waabi | Start-up linked to Uber’s former ATG; Uber Series C round, $750m plus $250m in milestones; self-driving software | |
| Wayve | AV software, equity investment; Wayve, Nissan and Uber in Tokyo in 2026 | |
| WeRide | Software and car maker; Abu Dhabi and Dubai (Uber app), plus 15 more cities by 2030, and an equity investment; 1.2K robotaxis by 2027 in the Middle East | |
| Hardware | NVIDIA | Hardware agreement across other software companies; Uber partnership |
| OEM and fleet | Lucid | Big partner: Uber off-take of 35K vehicles running Nuro software, plus 11% of the equity |
| May Mobility | Start-up vehicle manufacturer, deployed only in Arlington, Texas (Uber app) | |
| Motional | Hyundai’s subsidiary; in March ’26, the Hyundai Ioniq 5 was added to the Uber app in Las Vegas | |
| Rivian | Expected for 2028: 10K fully autonomous vehicles in SF and Miami; target for 2031: 25+ cities in the US, Canada and Europe | |
| Stellantis | Stellantis, Wayve and Uber partnership: London, Tokyo and 100 others | |
| Volkswagen | LA in 2027 (Uber app) | |
| Fleet operations | Avomo | Fleet services, cleaning, maintenance, charging, depot, in the Waymo partnership; plus fleet operations in Madrid for the WeRide and Uber launch on the Uber platform |
| Verne | Fleet owner: depot, charging, cleaning, regulatory approvals; the Zagreb agreement with Uber and Pony.ai | |
| Sidewalk | Avride | Autonomous sidewalk robots in Austin and Dallas (Uber Eats), plus robotaxis in Dallas (Uber app) |
| Starship Technologies | Sidewalk delivery robots (Uber Eats app), 2027 |
| Two live stacks | Munich framework | Madrid |
|---|---|---|
| Software | Autobrains: physical AI | WeRide |
| Hardware | NVIDIA | NVIDIA |
| OEM and fleet | Agnostic, so commoditized | WeRide, Avomo |
| Platform | Uber | Uber |
Catalysts to watch
Delivery Hero
- Settlement expected in H2’27; platform migrations in 2029. Financing: a $16.2b senior unsecured bridge, with the refinancing also covering Delivery Hero’s short-term debt. The pending purchase of Delivery Hero, in which Uber already has a stake: $13.7bn.
- 14 markets go to a private equity firm, including Glovo. Antitrust surprises are possible.
- A 5.5% adjusted EBITDA margin, against Uber’s 19.5%: potential for true synergies. H
London and Munich, 2027
London: paid driverless service in early 2027. Munich: 2027. A good test to monitor: whether the sequence of Denver, Las Vegas, San Diego and Tampa, flipping in a single month, generalizes to other, different cities and environments.
London is its own problem: regulation; depot and charging real estate at London prices; narrow lanes; shared surfaces; cyclist density; permanent roadworks.
Waymo + Moove (fleet operator) against Uber + Wayve: the London battlefield. Waymo enters directly, with its own app, Moove on operations and zero local brand; look at the waitlist. Let’s see how the experiment works: to monitor.
Ownership and the equity book
The Aurora stake. On June 30, Aurora closed at $6.82; on August 17, Uber sold at $6.55. The $0.27 difference on 72m shares is $19.44m, reported as a reclassified loss in Q3’26. H
| Insider activity, to August 16 | Bought | Sold | Net |
|---|---|---|---|
| CFO Balaji (SBC) | 4,393 | 2,247 | +2,146 |
| COO and president, MacDonald | 10,167 | 5,689 | +4,478 |
| Chief Corporate Affairs Officer, Jill | 9,159 | 4,626 | +4,533 |
| Chief Legal Officer, West | 7,196 | 3,570 | +3,626 |
| Chief Accounting Officer, Glen | 6,604 | 3,278 | +3,326 |
| Total | +18,109 |
Management keeps accumulating shares. On September 8, the COO bought 70,000 shares in the open market, a 19.6% increase, to 426,320: 78% at $75.65 (range $75.23–76.22) and 22% at $76.44 (range $76.23–76.85). i
Q2 change in Uber’s equity investments: Aurora −20.7%; Serve Robotics sold (−100%); Lucid +175%; Rivian, new; Grab, Joby and WeRide unchanged. i
What I watch
- AOI/GB by segment, every quarter: the only true comparison until Q1 2027.
- AV expansion: cities per year per AV competitor, and the time from announcement to paid service. If it shortens, the time-constraint moat is compressing.
- Whether Uber recovers the $1.8b of disputed UK VAT, as management believes.
- What Uber does in Phoenix after Waymo exits the Uber app.
- Uber Autonomous Solutions: what “7 live cities, 8 launching by the end of 2026” means.
- Still to pull: driver-side economics; restaurant-side take-rate data; mobility competition outside the US; the advertising revenue figure, the highest-margin line inside Delivery.
- The stock prices of Aurora (AUR), Delivery Hero (DH), Didi Global (DIDIY), Grab (GRAB) and Lucid (LCID); and Waabi, the Canadian start-up: strategic, and more.
- The four tests that would put the thesis under review (step 3).
Position on the day of publication: held. I don’t trade against a published view in the 72 hours after publishing it, except to carry out a pre-stated exit or risk limit. Not investment advice.