“GLP-1 is not affecting the stock; its fundamentals are.”
Not a cash cow, not a compounder: after the Q3 results, I’m exiting within one quarter.
Written
2026-10-05
Updated
2026-10-21
First published
2026-10-27
Position that day
Held, exiting
Archived copy
PDF, v22 versions
v2 · 2026-10-21currentQ3’26 results added (pages 1 and 4–8); four v1 figures corrected, marked †; the worst-case wording on page 1 revised.8 pages · 1.1 MB · SHA-256 170241d98df980d136512ddcff1c9fcd59974926d482edcf0de632370c75ed33 · archived ↗
v1 · 2026-10-05not onlineAs first written. Available on request; the fingerprint identifies the file.8 pages · SHA-256 d5e9c5644b7c679ad8503030a887c37a96e98d6d3ae77ac86b2b7db9c7f35ef2
I started legging in while the research ran. My estimate put the drag at a rounding error: another 5% of annual penetration costs about 0.5% of volume a year, as long as the core base stays stable.
2
Jul – Sep 2026
The base was not stable
The GLP-1 effect turned out to be indistinguishable from the other drags on volume. The weakness was in the fundamentals:
North American volumes falling, international growth inconsistent
Dividends above free cash flow: 103% in FY’25, 106% in FY’24
Rockstar impaired by $1.9b against a $4.7b all-in cost
Commodity costs and tariffs not offset by pricing
3
5 Oct 2026
Thesis replaced
“GLP-1 is not affecting the stock; its fundamentals are.”
Not a cash cow, not a compounder. Exit over one to two quarters.
4
8 Oct 2026 · Q3 results
Exit brought forward to one quarter
North America’s recovery is “taking longer than expected”: low guidance for Q4, and 2027 seems weak. Operating and commodity costs, both up, explicitly mentioned. Risk management started the same day.
Sealed record · the risk-management decision and its scenarios, opened at the exit, in per-share terms. SHA-256 fingerprint: c9416b29c9418236d2f01cecc188fe3fc0ad726cec3b9b8e37025090d53be2bc
5
Now · registered with the exit
Three tests that would pause the exit
PepsiCo Foods North America organic growth of 2% or more, with volume flat or up, for two quarters
Dividends at or below 90% of free cash flow, trailing twelve months
Core gross margin up year on year in both North American divisions for two quarters
Starting points, from the Q3 2026 results of 8 Oct: Foods North America organic growth −0.2%, volume +0.5%; dividends 103% of free cash flow in FY’25; core gross margin down year on year in Foods North America, 60.3% against 62.3%.
6
Before the Q4 2026 results
Out
Dates and sizes, as a share of capital, recorded as they happen; the sealed record opens.
7
After the exit
Closing file
A post-mortem against both theses: what I got right, what was luck, and what changes in the process.
Source page · US beverage share, bottling and retailers
The note
i filing · ii management · iii third party · H my calculation · quotes from my call notes
The entry thesis: GLP-1
The base is already in place: GLP-1 users in North America are 11% of adults, about 20% of households. A 10% decline in savory snacks is a −2% drag on volumes; another 5% of annual penetration is a further −0.5% a year. H
Worst case, applied to both estimates, with self-reported adherence overstating persistence and treatment discontinued after the first year: a rounding error for PepsiCo, provided the core base is stable and real consumption grows. The base was not stable.
Today the GLP-1 effect is indistinguishable from the other drags on volume. The exception is emerging markets, a growth vector for PepsiCo, where cheaper generics are coming. I’m watching it.
The exit thesis
I started with a thesis to enter. Now I have a new one, to hedge the position and exit: GLP-1 is not affecting the stock; its fundamentals are.
Declining growth in North America, inconsistent growth abroad
A stretched balance sheet, unhealthy dividends and very poor M&A execution
Unable to offset high commodity costs
Not a cash cow, not a compounder: exit over one to two quarters, brought forward to one quarter with the Q3 results.
Q3 2026: the exit brought forward
Management: North America’s recovery is “taking longer than expected”. Low guidance for Q4, and 2027 seems weak. Operating costs and commodity costs, both up, were explicitly mentioned. ii Recognizing a problem is necessary, but not enough; management didn’t seem hands-on enough to solve it.
PepsiCo Foods North America: volume contracted in every quarter of 2025. Q1’26 brought a +2% volume contribution to revenue, a huge surprise; then 0% in Q2 and a weak +0.5% in Q3. Not convincing. Physical volume was about flat: savory snacks +1%, offset by −4% in other foods. Meanwhile SG&A grew 6% year on year and cost of sales 0.74%, so margins keep deteriorating. H
PepsiCo Beverages North America had another quarter of negative volume, in a long series, while operating costs ramped up. The International Beverages Franchise and EMEA showed strength on all fronts, but North America, the most powerful consumer in the world, is more than half of operating profit. It needs good results, and an end to the streak of market-share losses.
Add a stretched balance sheet; a refinancing wall that, by my numbers, raises interest expense by about 10%; and a very stretched dividend payout that management won’t have the fortitude to cut in half, ending the Dividend King status, to manage the company better. H
Q2 2026 snapshot
Segment mix, Q2 2026 · shares computed from the segment disclosure H
Segment
Share of revenue
Operating margin
Share of operating profit
PepsiCo Foods North America
26.3%
21.1%
29.7%
PepsiCo Beverages North America
30.0%
14.5%
23.3%
US and Canada
56.3%
—
53.0%
International Beverages Franchise (high growth)
6.3%
41.8%
14.1%
EMEA
20.6%
15.1%
16.6%
LatAm Foods
12.2%
21.0%
13.6%
Asia Pacific Foods
4.6%
11.3%
3.0%
Cash flow H
$
FY’25
FY’24
FY’23
Operating cash flow, ex SBC
11.8b
12.1b
13.1b
Operating cash flow / revenue
12.6%
13.2%
14.3%
Free cash flow
7.4b
6.8b
7.5b
Dividends / free cash flow
103%
106%
89%
A Dividend King: a 7% dividend CAGR from 2010 to 2026 that can’t be repeated, and is now a drag on competitiveness. Buybacks run at about $1b a year, so in effect all of the return to shareholders comes from dividends; the share count fell 0.4% from Q1’24 to Q2’25 and 0.3% to Q2’26. i
Debt
Net debt is 37.9% of total assets. H A quarter of the debt, $10.6b, is short-term. i Assuming +100 bps on the debt that rolls, that is +$0.106b of interest in FY’26, or +9.5% year on year. H
Interest expense: $1.121b in H1’25 (+22% YoY), after $0.919b in H1’24 (+12% YoY). i
Beverages, bottling and retailers
PepsiCo
Coca-Cola
Market share, US liquid refreshment beverages iii
Market share, US liquid refreshment beverages iii
2016
2017
2018
2019
2020
2021
2022
2023
2024
2025
PepsiCo
24%
23%
22%
22%
22%
22%
20%
19%
18%
16%
Coca-Cola
20%
20%
20%
20%
20%
19%
21%
20%
21%
20%
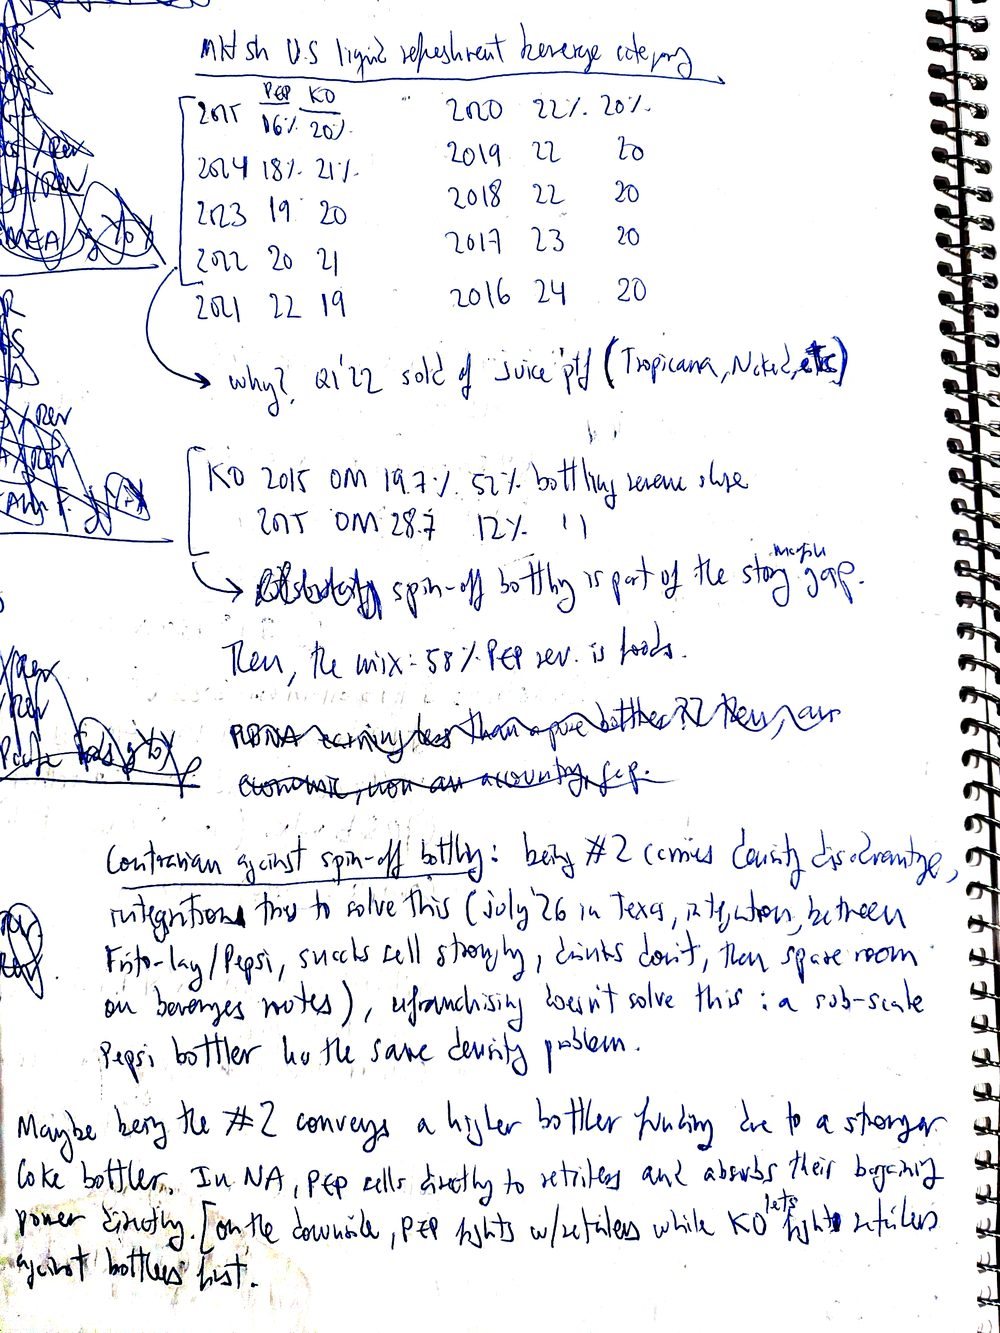
Why the slide? In Q1’22 PepsiCo sold its juice portfolio (Tropicana, Naked and others).
Coca-Cola spun off its bottling: its operating margin went from 19.7% in 2015 to 28.7% in 2025, while bottling fell from 52% to 12% of its revenue. i That spin-off is part of the margin gap. Then there is the mix: 58% of PepsiCo’s revenue is food.
Walmart is 14% of revenue. i In North America PepsiCo sells directly to retailers and absorbs their bargaining power itself. The downside: PepsiCo fights retailers head-on, while Coca-Cola lets its bottlers fight them first.
Contrarian: against spinning off bottling
Being number two means a density disadvantage. Integration tries to solve it, as in Texas in July ’26, where Frito-Lay and Pepsi were integrated: snacks sell strongly, drinks don’t, so there is spare room on beverage routes. Refranchising doesn’t solve it; a sub-scale Pepsi bottler has the same density problem. Being number two may also mean higher bottler funding, because the Coke bottler is stronger.
Management: “full refranchise not under consideration” and “a mosaic of structures”, given the Frito-Lay adjacency, a difference from Coca-Cola. ii
M&A: very poor execution
2020Rockstar: $4.7b all-in for a 6% market share
2022Juice portfolio sold to TBG, keeping a 39% equity stake
2024The TBG stake written off to zero
2025Rockstar impaired by $1.9b; Celsius: $1.1b of purchases
Feb ’26Pepsi Prebiotic Cola: US national launch
Jul ’26Pepsi Prebiotic Cola silently discontinued
Rockstar, a complete fiasco. $4.7b all-in cost in 2020 for a 6% market share; a $1.9b impairment in 2025, about 40% of the price; the US and Canada brand moved to Celsius at a $0.5b value, now with a 2% share. i
TBG, a mild disaster. $3.5b in cash, a $2.9b after-tax gain; then the 39% stake, worth $0.95b, written off to zero in 2024: about $1.95b net. H
Celsius. A distribution margin on $1.1b of purchases in ’25, with upside from Alani Nu. But if the Celsius brand weakens, so does PepsiCo’s preferred stake in Celsius: doubtful upside.
Pepsi Prebiotic Cola. A US national launch in February ’26, then silence: the wrong signal. In Q3’26, more silence: it had been discontinued in July ’26, without a word from management.
Poppi. A $300m earnout for 2027. In Q3’26 the earnout was revalued to $12m, after a $105m decrease in the quarter ($266m year to date), credited to SG&A. i Poppi probably won’t meet its 2027 targets. If that credit is inside Beverages North America’s core results, its Q3’26 SG&A growth would be about +10.8%, not the +7.27% reported. H
Core operating margin by segment
PepsiCo Foods North America
PepsiCo Beverages North America
EMEA
International Beverages Franchise
Core operating margin by segment, Q1’25 to Q3’26 H
From the quarterly press releases; full bridges (volume, price and mix, FX, cost of sales, SG&A) in the notebook H
Segment
Q1’25
Q2’25
Q3’25
Q4’25
Q1’26
Q2’26
Q3’26
PepsiCo Foods North America
25.5%
23.5%
24.7%
23.5%
24.0%
21.5%
21.2%
PepsiCo Beverages North America
10.1%
14.5%
13.4%
9.0%
10.7%
14.6%
13.9%
International Beverages Franchise
35.3%
38.7%
40.0%
34.1%
41.2%
42.7%
40.7%
EMEA
8.9%
14.7%
16.6%
15.3%
11.8%
15.9%
17.2%
A broken scale: gross and operating profit include FX and acquisitions, while the denominator, organic revenue, doesn’t. The mismatch gives the impression of a higher margin. But each period is compared with the same period on the same broken scale, not with a competitor, so the scale still measures changes in margin. Without FX and acquisitions, the Beverages North America margin declines big time, and EMEA’s is worsening. H
What I watch
The “carrying value” language in the 10-K, for early warnings of future impairments: SodaStream is on the edge.
Pricing: the Q1’26 price cuts in foods lifted volume for only one quarter; in Q2 it was flat. Management’s next move is price increases at the end of ’26 and in Q1’27.
GLP-1 adoption in emerging markets as cheaper generics arrive.
The three tests that would pause the exit (step 5).
Position on the day of publication: held, exiting. I don’t trade against a published view in the 72 hours after publishing it, except to carry out a pre-stated exit or risk limit. Not investment advice.